Garanti BBVA in Numbers
| Branch |
795 |
795 |
| Domestic |
787 |
789 |
| Abroad |
8 |
6 |
| Personnel |
23,311 |
23,376 |
| ATM |
6,558 |
6,537 |
| POS |
870,653 |
886,943 |
| Total Customer |
30,141,660 |
30,610,905 |
| Digital Banking Customer |
18,040,749 |
18,234,320 |
| Mobile Banking Customer |
17,893,337 |
18,096,397 |
| Credit Card Customer |
13,226,733 |
13,562,178 |
| Credit Cards |
19,153,633 |
19,798,022 |
| Debit Cards |
23,387,621 |
23,756,656 |
ASSET BREAKDOWN
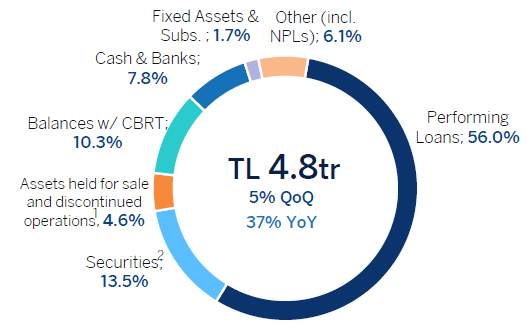
1In 1Q26, due to the ongoing sale process of our Romania subsidiary, related balance sheet items have been reclassified under “Assets held for sale and discontinued operations.”
2$3bn short-term placement to high-quality liquid assets at quarter-end resulted in a temporary increase in FC securities balance
LIABILITIES & SHE BREAKDOWN
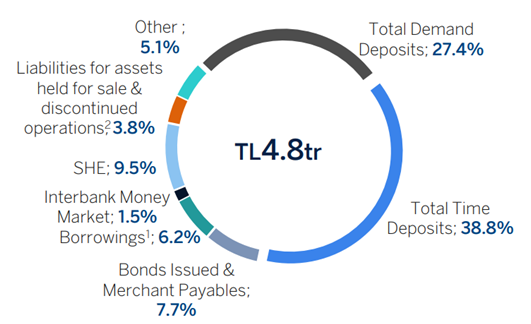
1Includes funds borrowed, sub-debt & FC securities issued.
2In 1Q26, due to the ongoing sale process of our Romania subsidiary, related balance sheet items have been reclassified under “Liabilities for assets held for sale and assets of discontinued operations.”
Note: Figures are per 31 March 2026 BRSA consolidated financials.
MARKET SHARES
| TL loans |
22.1% |
21.9% |
-12 bps |
#1* |
| Consumer Loans inc. Consumer CCs |
17.7% |
17.5% |
-18 bps |
#1* |
| Cons. Mortgage Loans |
16.0% |
16.3% |
22 bps |
#2* |
| Consumer Auto Loans |
31.9% |
31.7% |
-16 bps |
#1* |
| Cons. General Purpose Loans |
16.5% |
16.1% |
-45 bps |
#2* |
| TL Business Banking |
8.0% |
8.1% |
17 bps |
#2* |
| # of CC customers 2 |
14.7% |
14.7% |
4 bps |
#1 |
| Issuing Volume (Cumulative) 2 |
17.3% |
17.3% |
1 bps |
#1 |
| Acquiring Volume (Cumulative) 2 |
15.8% |
15.4% |
-35 bps |
#1 |
*Rankings are among private banks as of December 2025
1 Sector figures used in market share calculations are based on bank-only BRSA weekly data, for private commercial banks
2 Cumulative figures and rankings as of March 2026, as per Interbank Card Center data. Rankings are among private banks.
| Net Interest Income |
71,431 |
| Operating Expenses |
-54,276 |
| - HR Costs |
-19,384 |
| - Other Operating Expenses |
-34,892 |
| Net Exp. Loan Loss Prov. (excl. Currency impact)1 |
-13,573 |
| Net Fees & Commissions |
42,859 |
| NET INCOME |
33,615 |
| Return on Average Equity |
30.3% |
| Return on Average Assets |
2.9% |
| NIM Incl. swap cost (Cumulative) |
6.1% |
| Non-Performing Loans Ratio |
3.3% |
| Capital Adequacy Ratio |
16.2% |
| Net Cost of Risk1 |
1.94% |
| FEE / OPEX |
79% |
| Cost / Income |
46% |
Note: Figures are per 31 March 2026 BRSA Consolidated financials
1 Neutral impact at bottom line, as provisions due to currency depreciation are 100% hedged (FX gain included in Net trading income line)